How to Build a Lead Response Time Dashboard for Your Small Business

On this page 7 sections
Key takeaways
- Track four core metrics: enquiry volume, first-response time, contact rate and booked-job rate
- Report response times in bands: under 5 min, under 1 hour, under 24 hours, over 24 hours
- Separate marketing problems from follow-up problems using your dashboard data
- A spreadsheet or basic CRM is enough to start record every enquiry and its outcome
- Feed qualified and won outcomes back into Google Ads for smarter bidding
Most small business owners track marketing by clicks and form submissions, then wonder why revenue doesn't follow. The gap between a lead arriving and a job actually being booked is where most opportunities disappear. A lead response time dashboard shows you exactly where that leakage happens so you can fix it.
Why clicks and form submissions are not enough
Your ad gets clicked, a form gets filled, and your marketing platform counts it as success. But did anyone answer the phone within an hour? Did the lead actually get qualified as a real opportunity? Did it turn into a booked job? Without tracking those stages, you're flying blind.
The gap between a lead and a booked job
A form submission is not a customer. It's the start of a conversation that may never happen. One business might receive 50 enquiries a month and book 10 jobs. Another might receive the same 50 but book only 3. The marketing channels look identical until you dig into response times, contact rates and what actually happened after first contact.
Building a marketing dashboard for small business means tracking the whole journey, not just the entrance. That journey includes whether the lead was ever contacted, whether it qualified as a real opportunity, and whether it converted to revenue.
How slow response time costs you customers
Speed matters in lead follow-up. Humming Web research shows that businesses responding within an hour are significantly more likely to qualify a lead than those waiting 24 hours or longer. When you don't know how long your first response is taking, you can't fix the problem.
If your team is answering emails but not making phone calls, or if missed calls are piling up, you'll never see that in a clicks-only report. A dashboard forces you to measure contact rate, which exposes those bottlenecks immediately.
The four stages every lead passes through
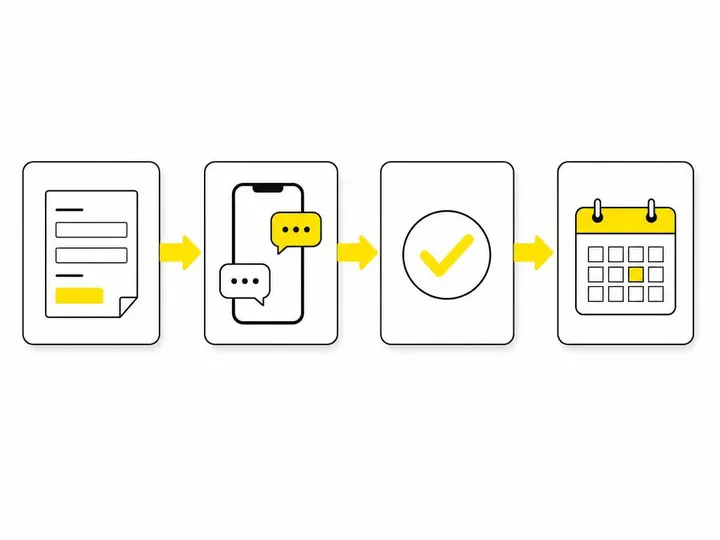
Every enquiry moves through a predictable pipeline: received, contacted, qualified, and either booked or lost. Building your dashboard around these stages lets you see exactly where leads drop out.
Received enquiry
The lead arrives via phone, form, email, Google Business Profile or a referral. Record the time, channel and source immediately. This is your denominator for every other metric.
Contacted lead
You made genuine contact with the person. Not an email sent into the void, but a phone call answered, a text conversation started, or a reply received. Without this stage, you can't measure whether response time is actually the problem.
Qualified opportunity
The person is a genuine prospect: they fit your ideal customer profile, the job is in scope, they have a realistic budget and timeline. Not every lead qualifies, and that's okay. Knowing your qualified-lead rate helps you see whether the problem is lead quality or sales process.
A lead qualification checklist for small business helps your team decide quickly whether an opportunity is worth pursuing.
Booked job or lost lead
The outcome is recorded: booked, not-interested, too expensive, no-response, or competitor-won. This closes the loop and tells you which leads actually drove revenue.
What to track in your lead response dashboard
Your dashboard does not need to be complex, but it must include core columns that let you spot problems in real time.
Core columns for every enquiry
Enquiry date and time
Lead source (Google Ads, organic search, Google Business Profile, Meta Ads, referral, website form)
Google Ads campaign (if applicable)
First-response time (minutes or hours)
Response channel (phone call, SMS, email, WhatsApp)
Contact status (contacted, no-answer, no-response, voicemail)
Qualification status (qualified, not-qualified, pending)
Outcome (booked, lost, in-progress)
Lost-lead reason (price, timeline, out-of-scope, competitor, no-response)
Booked-job date and estimated or actual revenue
You don't need a fancy tool to start. A spreadsheet with these columns gives you more actionable data than any marketing platform alone.
Response-time bands you can act on
Report your first-response time in bands: within 5 minutes, within 1 hour, within 24 hours and after 24 hours. Set a realistic target for each channel. Phone enquiries might aim for 5 minutes; email might aim for 2 hours. Show overdue leads prominently so your team knows what to chase today.
Automating lead notifications helps your team respond faster by alerting them instantly when a new enquiry arrives.
Lost-lead reason and revenue by source
Compare booked-job rates and total revenue by source. One channel might deliver high volume but low quality. Another might deliver fewer enquiries but higher conversion and revenue. Tracking lead sources accurately helps you invest in channels that actually drive business, not just clicks.
How to separate marketing problems from follow-up problems
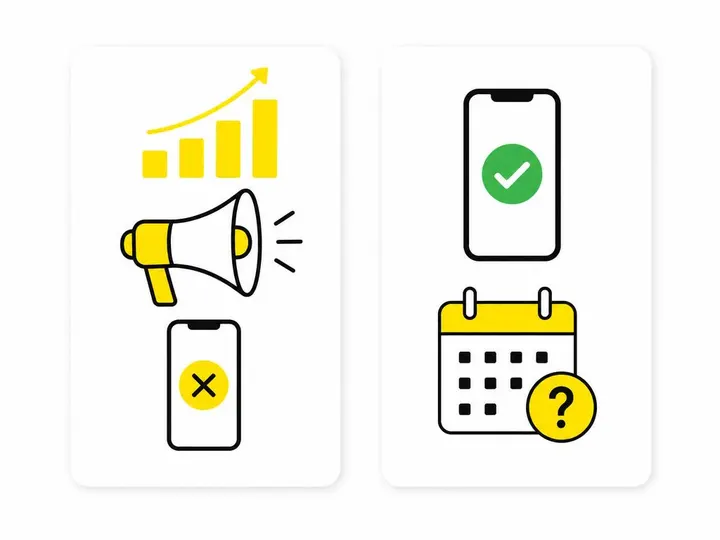
A dashboard shows you which end of the funnel is broken: the traffic end or the follow-up end.
High volume, low contact rate
You're getting plenty of enquiries but contacting only a small percentage. This points to operational issues: missed calls, incomplete contact details, no one at the desk during business hours, or no automated alerts. It's not a marketing problem. Fix follow-up speed and your contact rate will climb without spending more on ads.
How to follow up website leads effectively includes tactics like SMS confirmation and structured follow-up sequences that improve contact rates.
High contact rate, low booking rate
You're reaching people consistently but not converting them to jobs. The problem is usually offer, price, sales process, or lead quality. Your marketing is working; your sales conversation is not. This calls for a different fix: trial pricing, better qualification upfront, or sales training.
If your qualified-lead rate is high but your booked-job rate is low, you know the conversation is the bottleneck, not the lead.
Tools you can use to build the dashboard
Start simple. Complexity kills consistency, and a consistent spreadsheet beats an abandoned CRM every time.
Starting with a spreadsheet
Google Sheets or Excel works fine for a small business. Add a row for each enquiry, fill in the columns above, and review weekly. Automate timestamps where your system allows; manual entry is okay if it forces you to record data consistently.
Using a CRM
A CRM for small business like HubSpot, Pipedrive or Zoho tracks enquiries, contacts and outcomes in one place. Many CRMs timestamp actions automatically and let you run reports without manual work. If your team is already using a CRM, use its built-in reporting rather than building a separate sheet.
Connecting outcomes back to Google Ads
Google Ads now supports offline conversion tracking and enhanced conversions for leads. When you book a job from a Google Ads enquiry, you can send that outcome back to Google Ads so the platform can optimise bidding toward qualified leads and booked jobs, not just form fills. Google Ads Developer Blog guidance on call conversion tracking (November 2026) explains how to send call outcomes into the platform.
This feedback loop means your ad spend improves over time as Google learns which traffic sources and campaigns actually drive real revenue.
How to review and act on the dashboard weekly
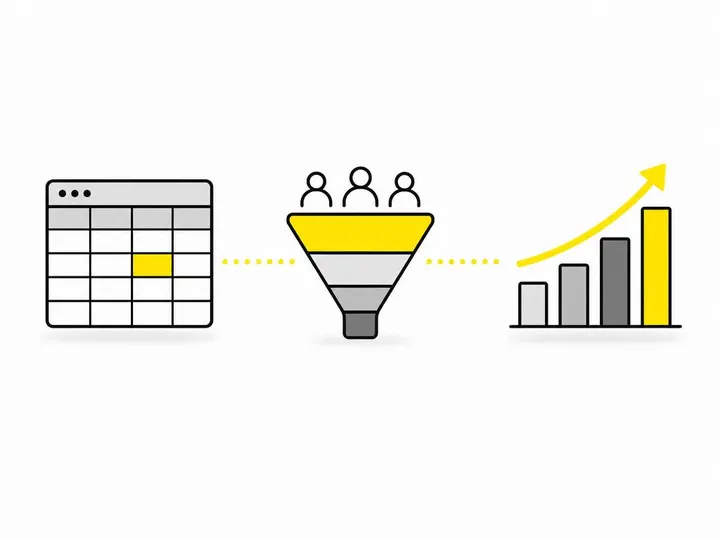
A dashboard is useless if no one looks at it. Schedule a 15-minute weekly review to spot trends and chase overdue leads.
What to check in a 15-minute weekly review
Total enquiries received this week
Contact rate (percentage of enquiries reached)
Booked jobs and revenue by source
Average and median first-response time by channel
Overdue leads (not contacted after 24 hours)
Lost-lead reasons (price, timeline, competitor, no-response)
Tracking cost per booked job in marketing helps you see which channels and campaigns are most profitable, not just cheapest.
When to escalate from weekly to daily
If your contact rate drops below 70%, or if more than a handful of leads go unanswered for 24 hours, escalate to daily standup reviews until the problem is fixed. Slow response compounds quickly when you're not watching daily.
Many small businesses also benefit from missed call text-back automation and AI-assisted lead response tools that acknowledge enquiries instantly and schedule follow-up, freeing your team to focus on qualified conversations.
Conclusion
A lead response time dashboard transforms how you think about marketing. Instead of counting clicks and form submissions, you see the full journey from enquiry to booked job. You spot whether losses are due to slow follow-up, poor qualification, or weak sales process. Most importantly, you can fix the actual problem instead of guessing.
Start with a spreadsheet today. Record source, contact time, response channel, qualification status and outcome for every enquiry. Review it weekly. After four weeks, you'll know exactly where your leads disappear and what to fix first. That's more insight than most small businesses ever get from their marketing platform alone.