Google Analytics 4 (GA4) is the latest version of the free web analytics service by Google. It tracks both website and app traffic and events and provides insights into user behaviour, conversions, and campaign performance.
GA4 has a new interface and a different set of reports than the previous Universal Analytics (UA). In this article, we will explore the various types of GA4 reports, how to access and customize them, and how to use them to improve your business outcomes.
In this article, we delve into the world of reports in Google Analytics 4, exploring their types, functionalities, and how they can empower marketers to drive meaningful results.
Understanding Google Analytics 4 Reports
Reports in Google Analytics 4 are designed to provide actionable insights into user interactions across various touchpoints. Unlike its predecessor, Universal Analytics, GA4 adopts an event-based data model, allowing for more flexible tracking of user actions. This shift enables a deeper understanding of user behaviour, encompassing interactions beyond traditional pageviews.
How to Use GA4 Reports to Grow Your Business
GA4 reports can help you answer important questions about your business, such as:
- Who are your users and what are their characteristics?
- How do users find your website or app and what are their sources?
- How do users interact with your website or app and what are their actions?
- How do users convert and what are their outcomes?
- How do users retain and what are their patterns?
By answering these questions, you can gain insights into your user behaviour, preferences, and needs. You can also identify the strengths and weaknesses of your website or app and the opportunities and challenges for your business.
Based on these insights, you can take actions to improve your website or app, such as:
- Optimize your design, content, and functionality to enhance user experience and satisfaction.
- Implement best practices for SEO, SEM, and social media to increase your traffic and visibility.
- Create and test different versions of your landing pages, offers, and CTAs to increase your conversions and revenue.
- Segment and target your users based on their attributes, behaviours, and interests to personalize your marketing and communication.
- Retain and engage your users with loyalty programs, rewards, and notifications to increase your retention and lifetime value.
Key Types of Reports
1. Real-time Report
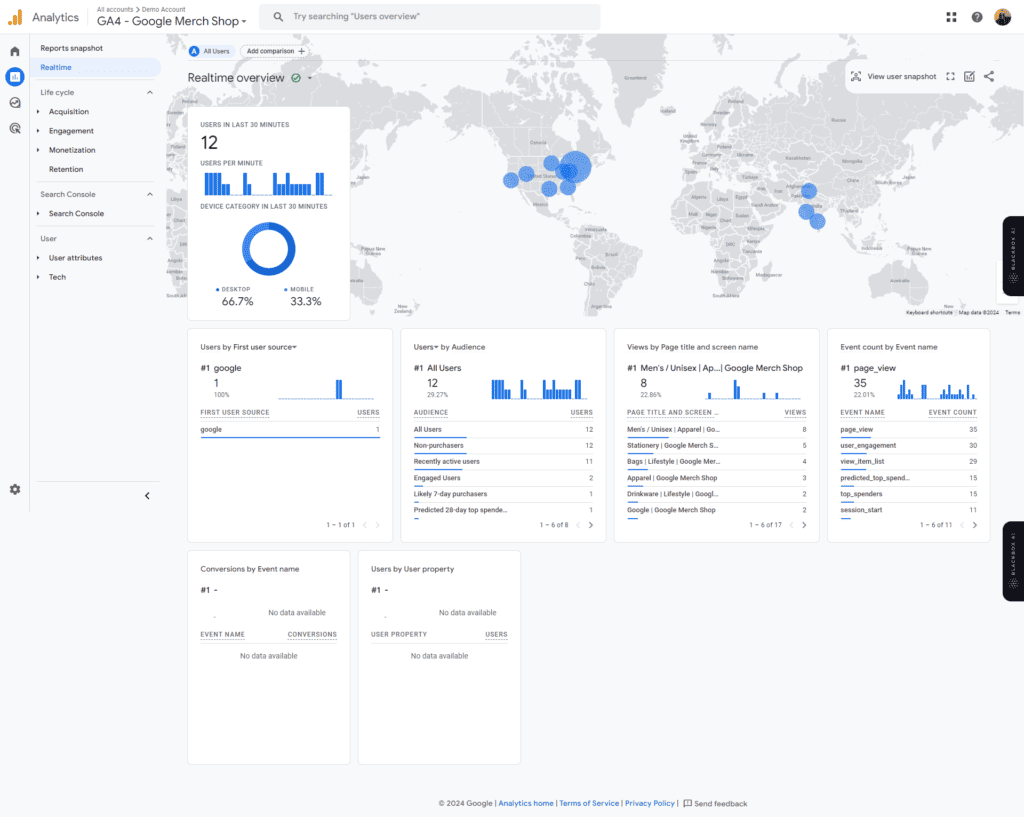
Real-time reports in GA4 offer instantaneous insights into user activity as it happens on your website or app. Marketers can monitor active users, events, and conversions in real-time, allowing for timely optimizations and campaign adjustments. This report is particularly useful for evaluating the immediate impact of marketing initiatives or tracking the performance of live events.
2. Event Reports
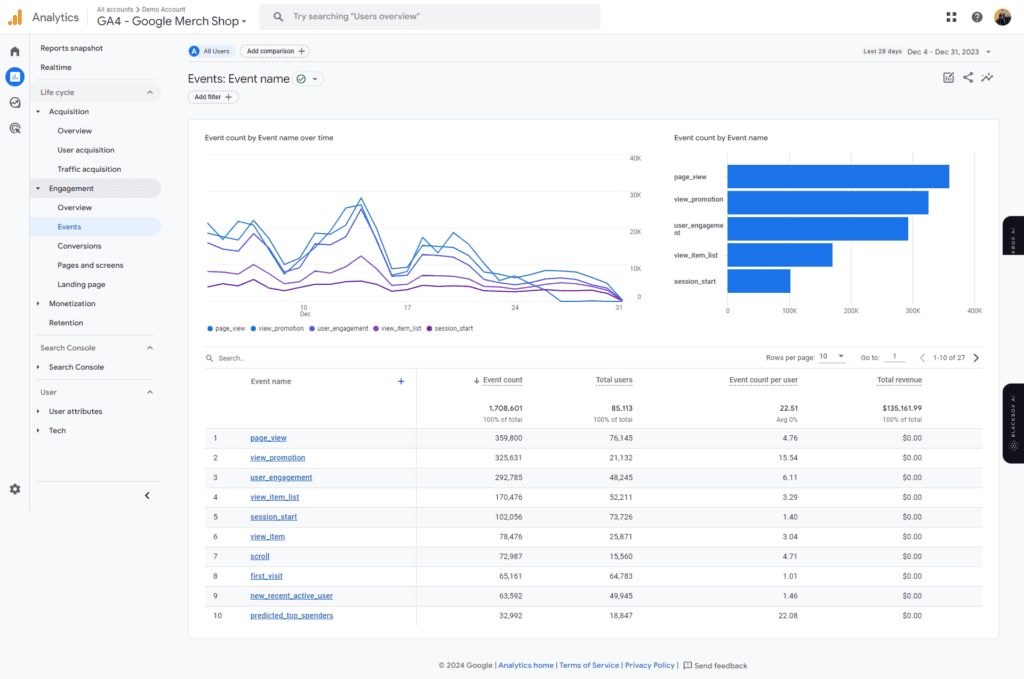
The event report shows all the events on your website and that you have configured in your Google Tag Manager. This report shows the events that users trigger on your website or app, such as clicks, downloads, purchases, or video plays. You can see the total number of events, the unique users who triggered them, and the average value per event. You can also see the breakdown of events by category, action, label, or name, and filter by event parameters or user properties.
3. Traffic Acquisition report
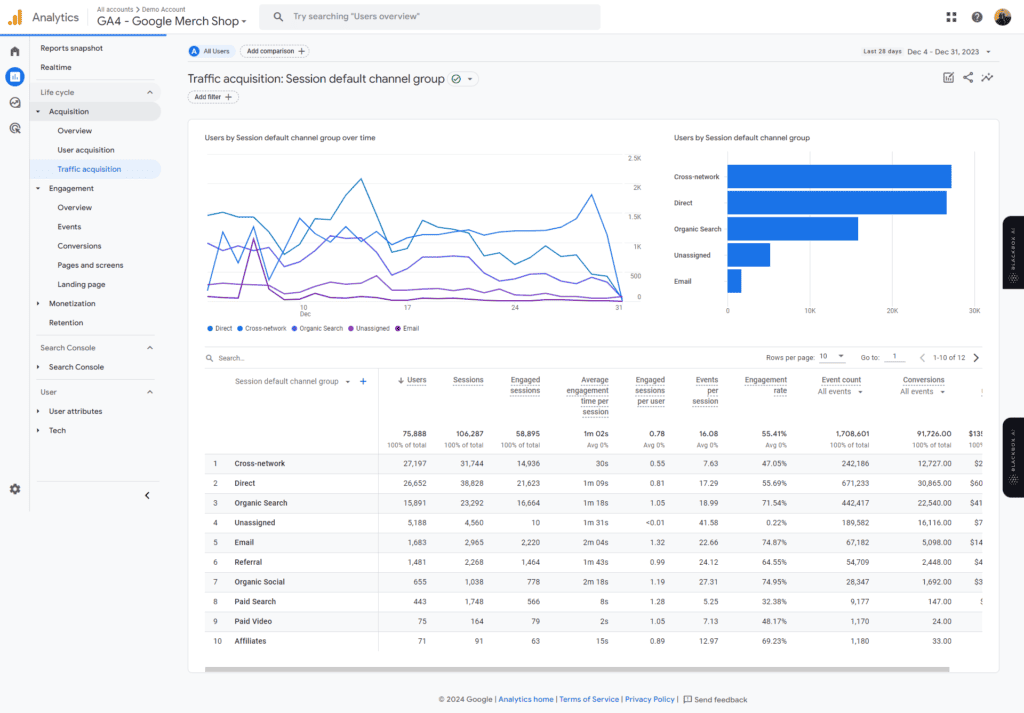
The Traffic Acquisition reports show where the traffic is coming from and user engagements. This report shows the sources that drive users to your website or app, such as organic search, paid search, social media, email, or referral. You can see the number of users, sessions, and conversions from each source, and the average session duration and bounce rate. You can also see the breakdown of sources by medium, campaign, or keyword, and filter by user properties or event parameters.
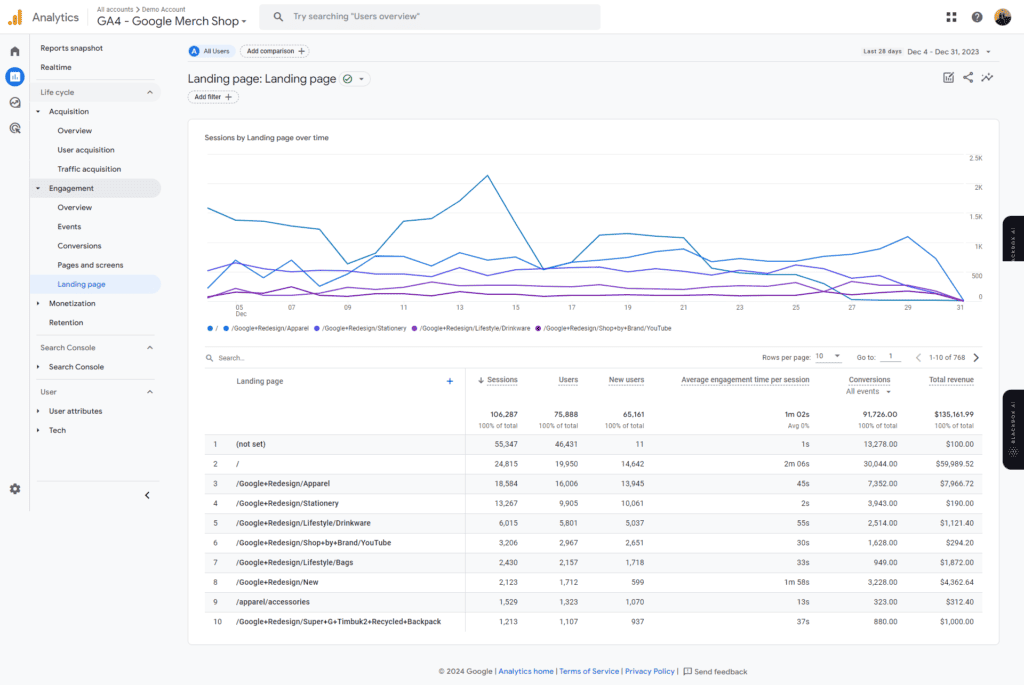
4. Landing Page
The landing page is the first page that the user sees when they come to your website. This report shows the first pages that users see when they visit your website or the first screens that users see when they open your app. You can see the number of users, sessions, and conversions from each landing page or screen, and the average session duration and bounce rate. You can also see the breakdown of landing pages or screens by device category, country, or app version, and filter by user properties or event parameters.
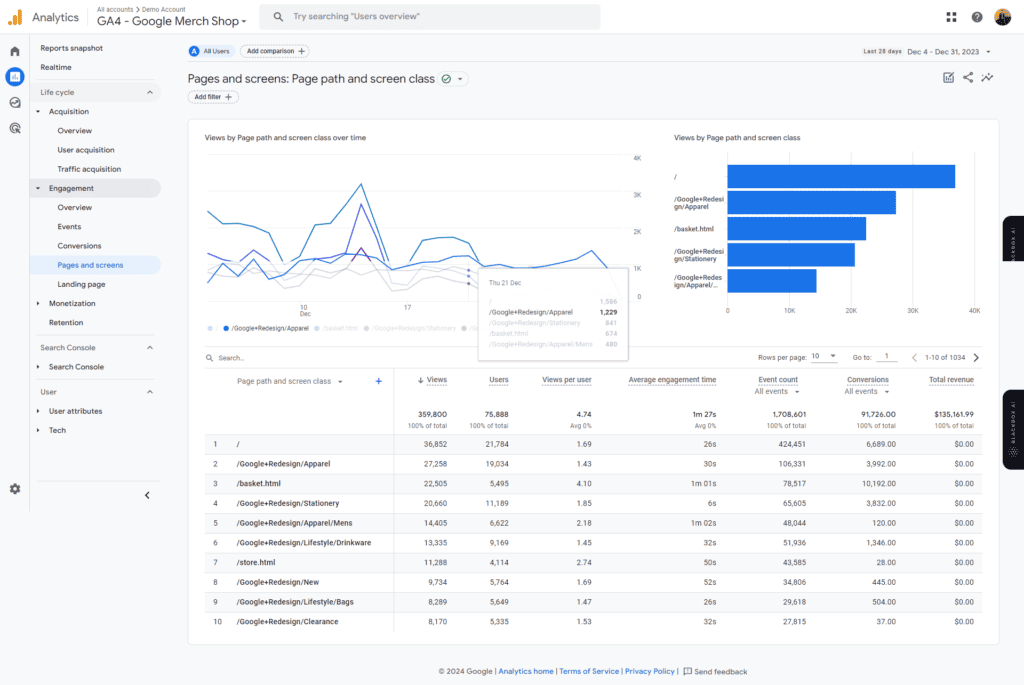
5. Pages and screen report
The Pages and screen reports show the total number of interactions with the pages. This report shows the pages that users view on your website or the screens that users view on your app. You can see the total number of page views or screen views, the unique users who viewed them, and the average time spent on each page or screen. You can also see the breakdown of pages or screens by title, path, or name, and filter by user properties or event parameters.
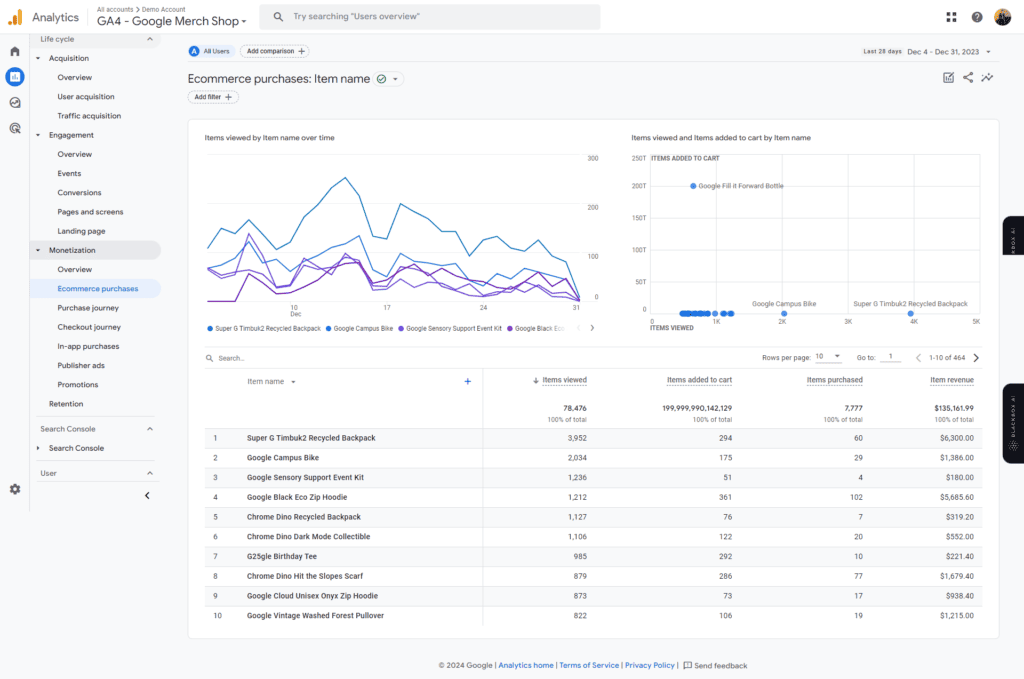
6. E-commerce Purchase
This Report shows the purchase of the product with the product details. This report shows the purchases that users make on your website or app, such as products, subscriptions, or in-app purchases. You can see the total revenue, the number of transactions, and the average order value. You can also see the breakdown of purchases by product name, category, or SKU, and filter by user properties or event parameters
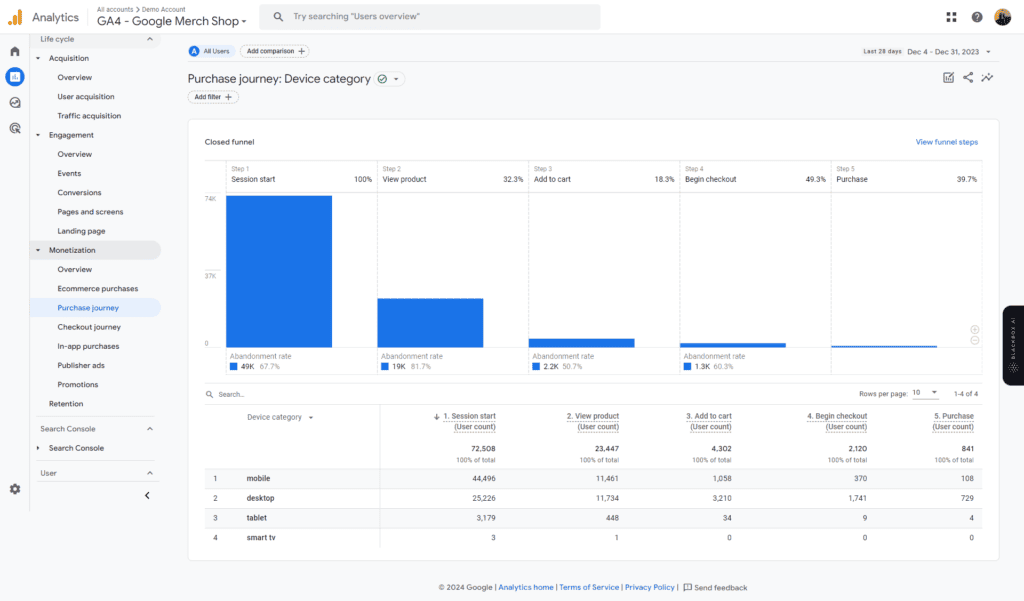
7. Purchase Journey
This report shows the journey to the purchase of the product. This report shows the steps that users take before they purchase on your website or app, such as viewing a product, adding it to a cart, or starting checkout. You can see the conversion rate, the drop-off rate, the completion rate for each step, and the average time spent on each step. You can also see the breakdown of steps by device category, country, or app version, and filter by user properties or event parameters.
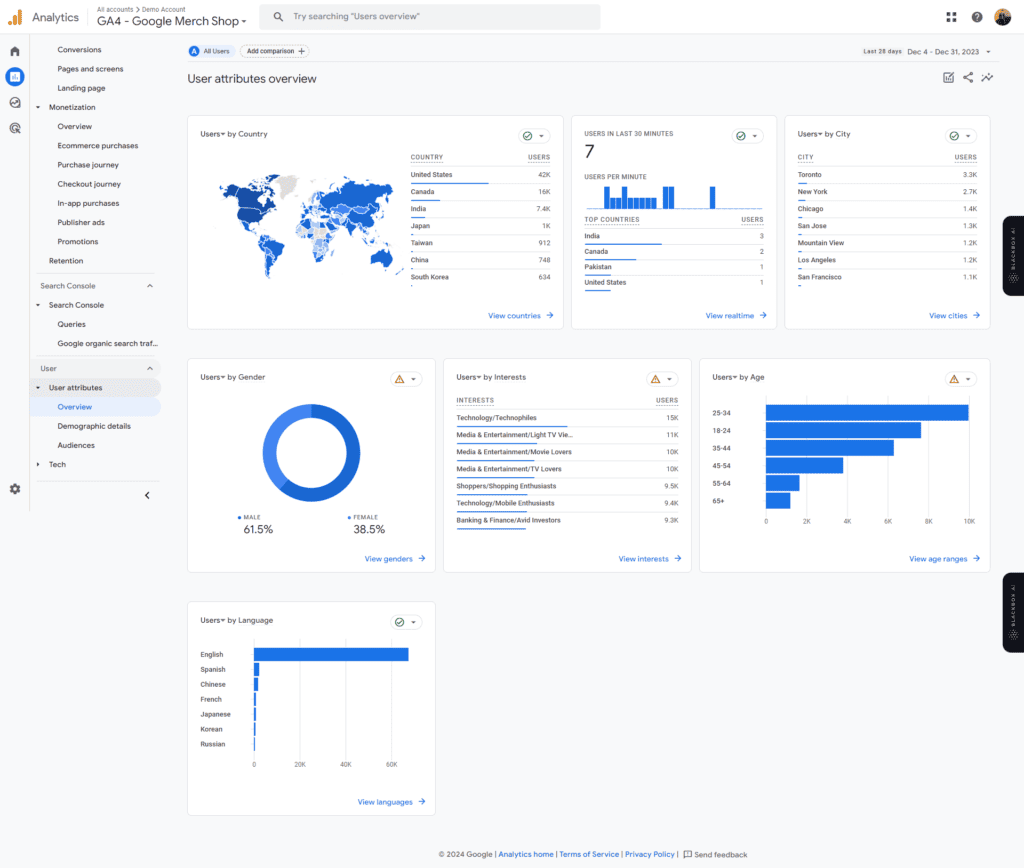
8. User Attribute Overview
It shows what kind of users are visiting your website with all ages, interests, countries, languages, and genders. User reports focus on understanding the characteristics and behaviours of your audience. They provide insights into user demographics, interests, and engagement across different devices and platforms. By analyzing user data, marketers can tailor their strategies to better align with the preferences and needs of their target audience
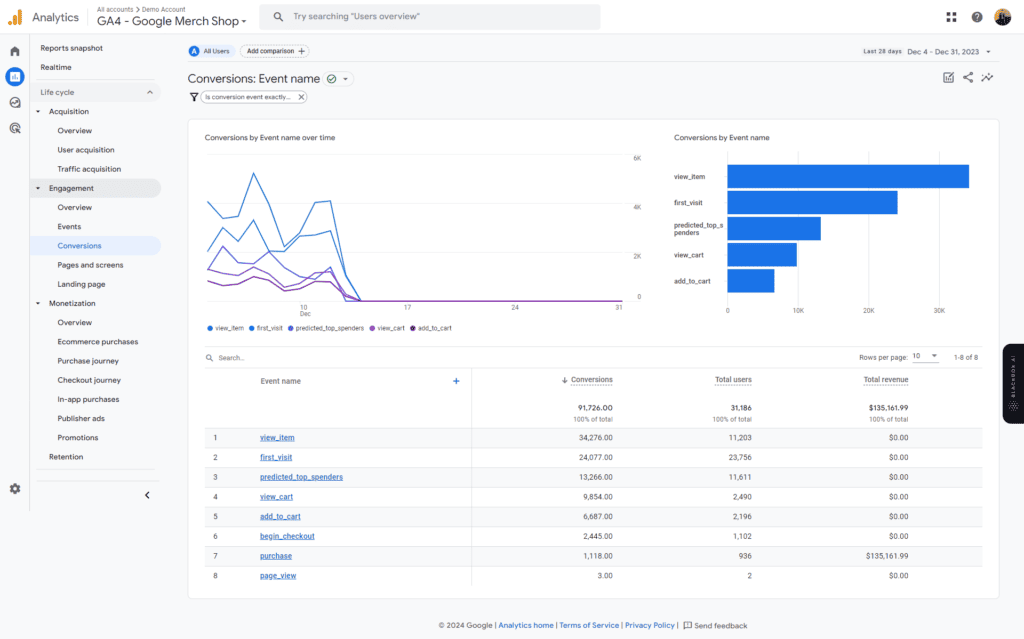
9. Conversion key report
Conversion reports focus on tracking key actions or events that contribute to your business objectives. Whether it’s completing a purchase, signing up for a newsletter, or downloading a whitepaper, conversion tracking enables marketers to measure the effectiveness of their campaigns and optimize for desired outcomes. GA4 offers enhanced conversion tracking capabilities, including customizable events and predictive metrics
10. Tech details
This report shows the technical details of the devices and browsers that users use to access your website or app, such as device model, operating system, browser, or screen resolution. You can see the number of users, sessions, and conversions from each device or browser, and the average session duration and bounce rate. You can also see the breakdown of devices or browsers by device category, country, or app version, and filter by user properties or event parameters.
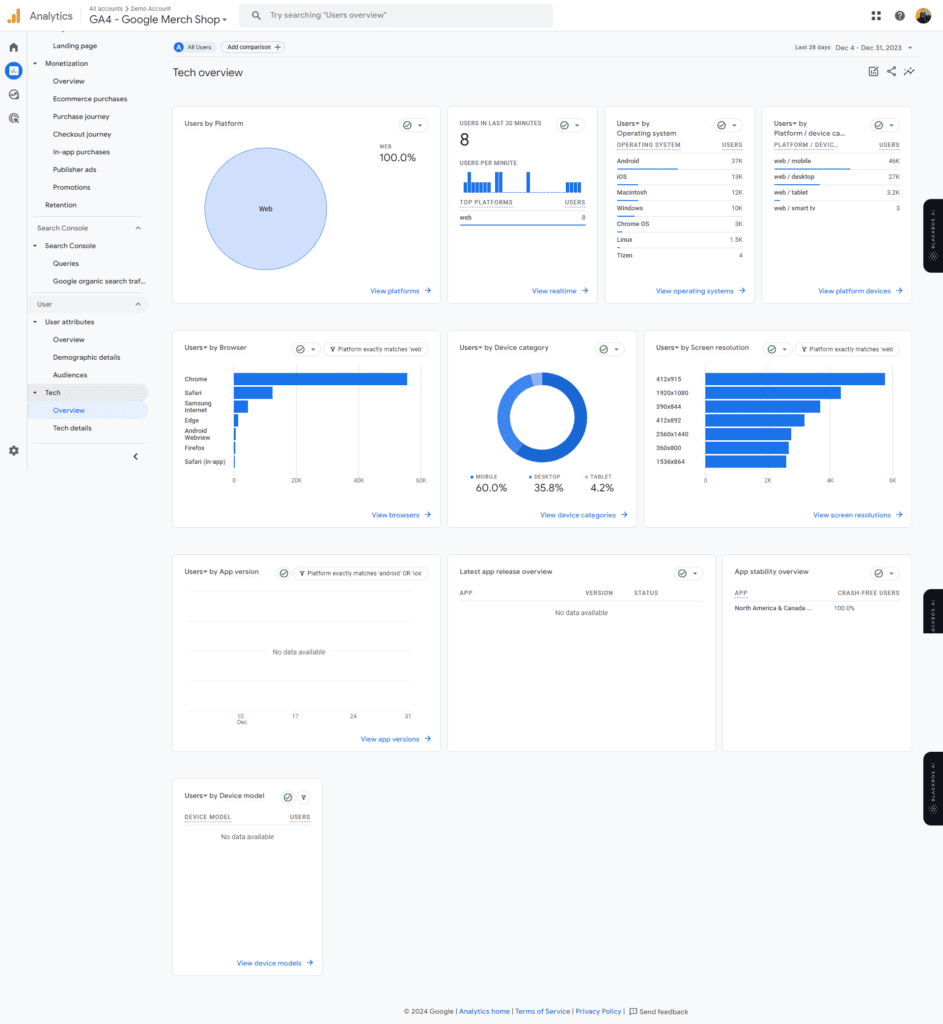
You can also check the exploration for more custom reports and more detailed forms of your report.
Conclusion
Reports in Google Analytics 4 serve as a cornerstone for data-driven decision-making in digital marketing. By leveraging real-time insights, user-centric analysis, and advanced features, marketers can optimize their strategies, enhance user experiences, and drive meaningful results. As businesses navigate the evolving digital landscape, mastering the art of reporting in GA4 is essential for staying ahead of the competition and delivering value to customers. With its powerful capabilities and intuitive interface, Google Analytics 4 empowers marketers to unlock the full potential of their data and achieve their business objectives.

